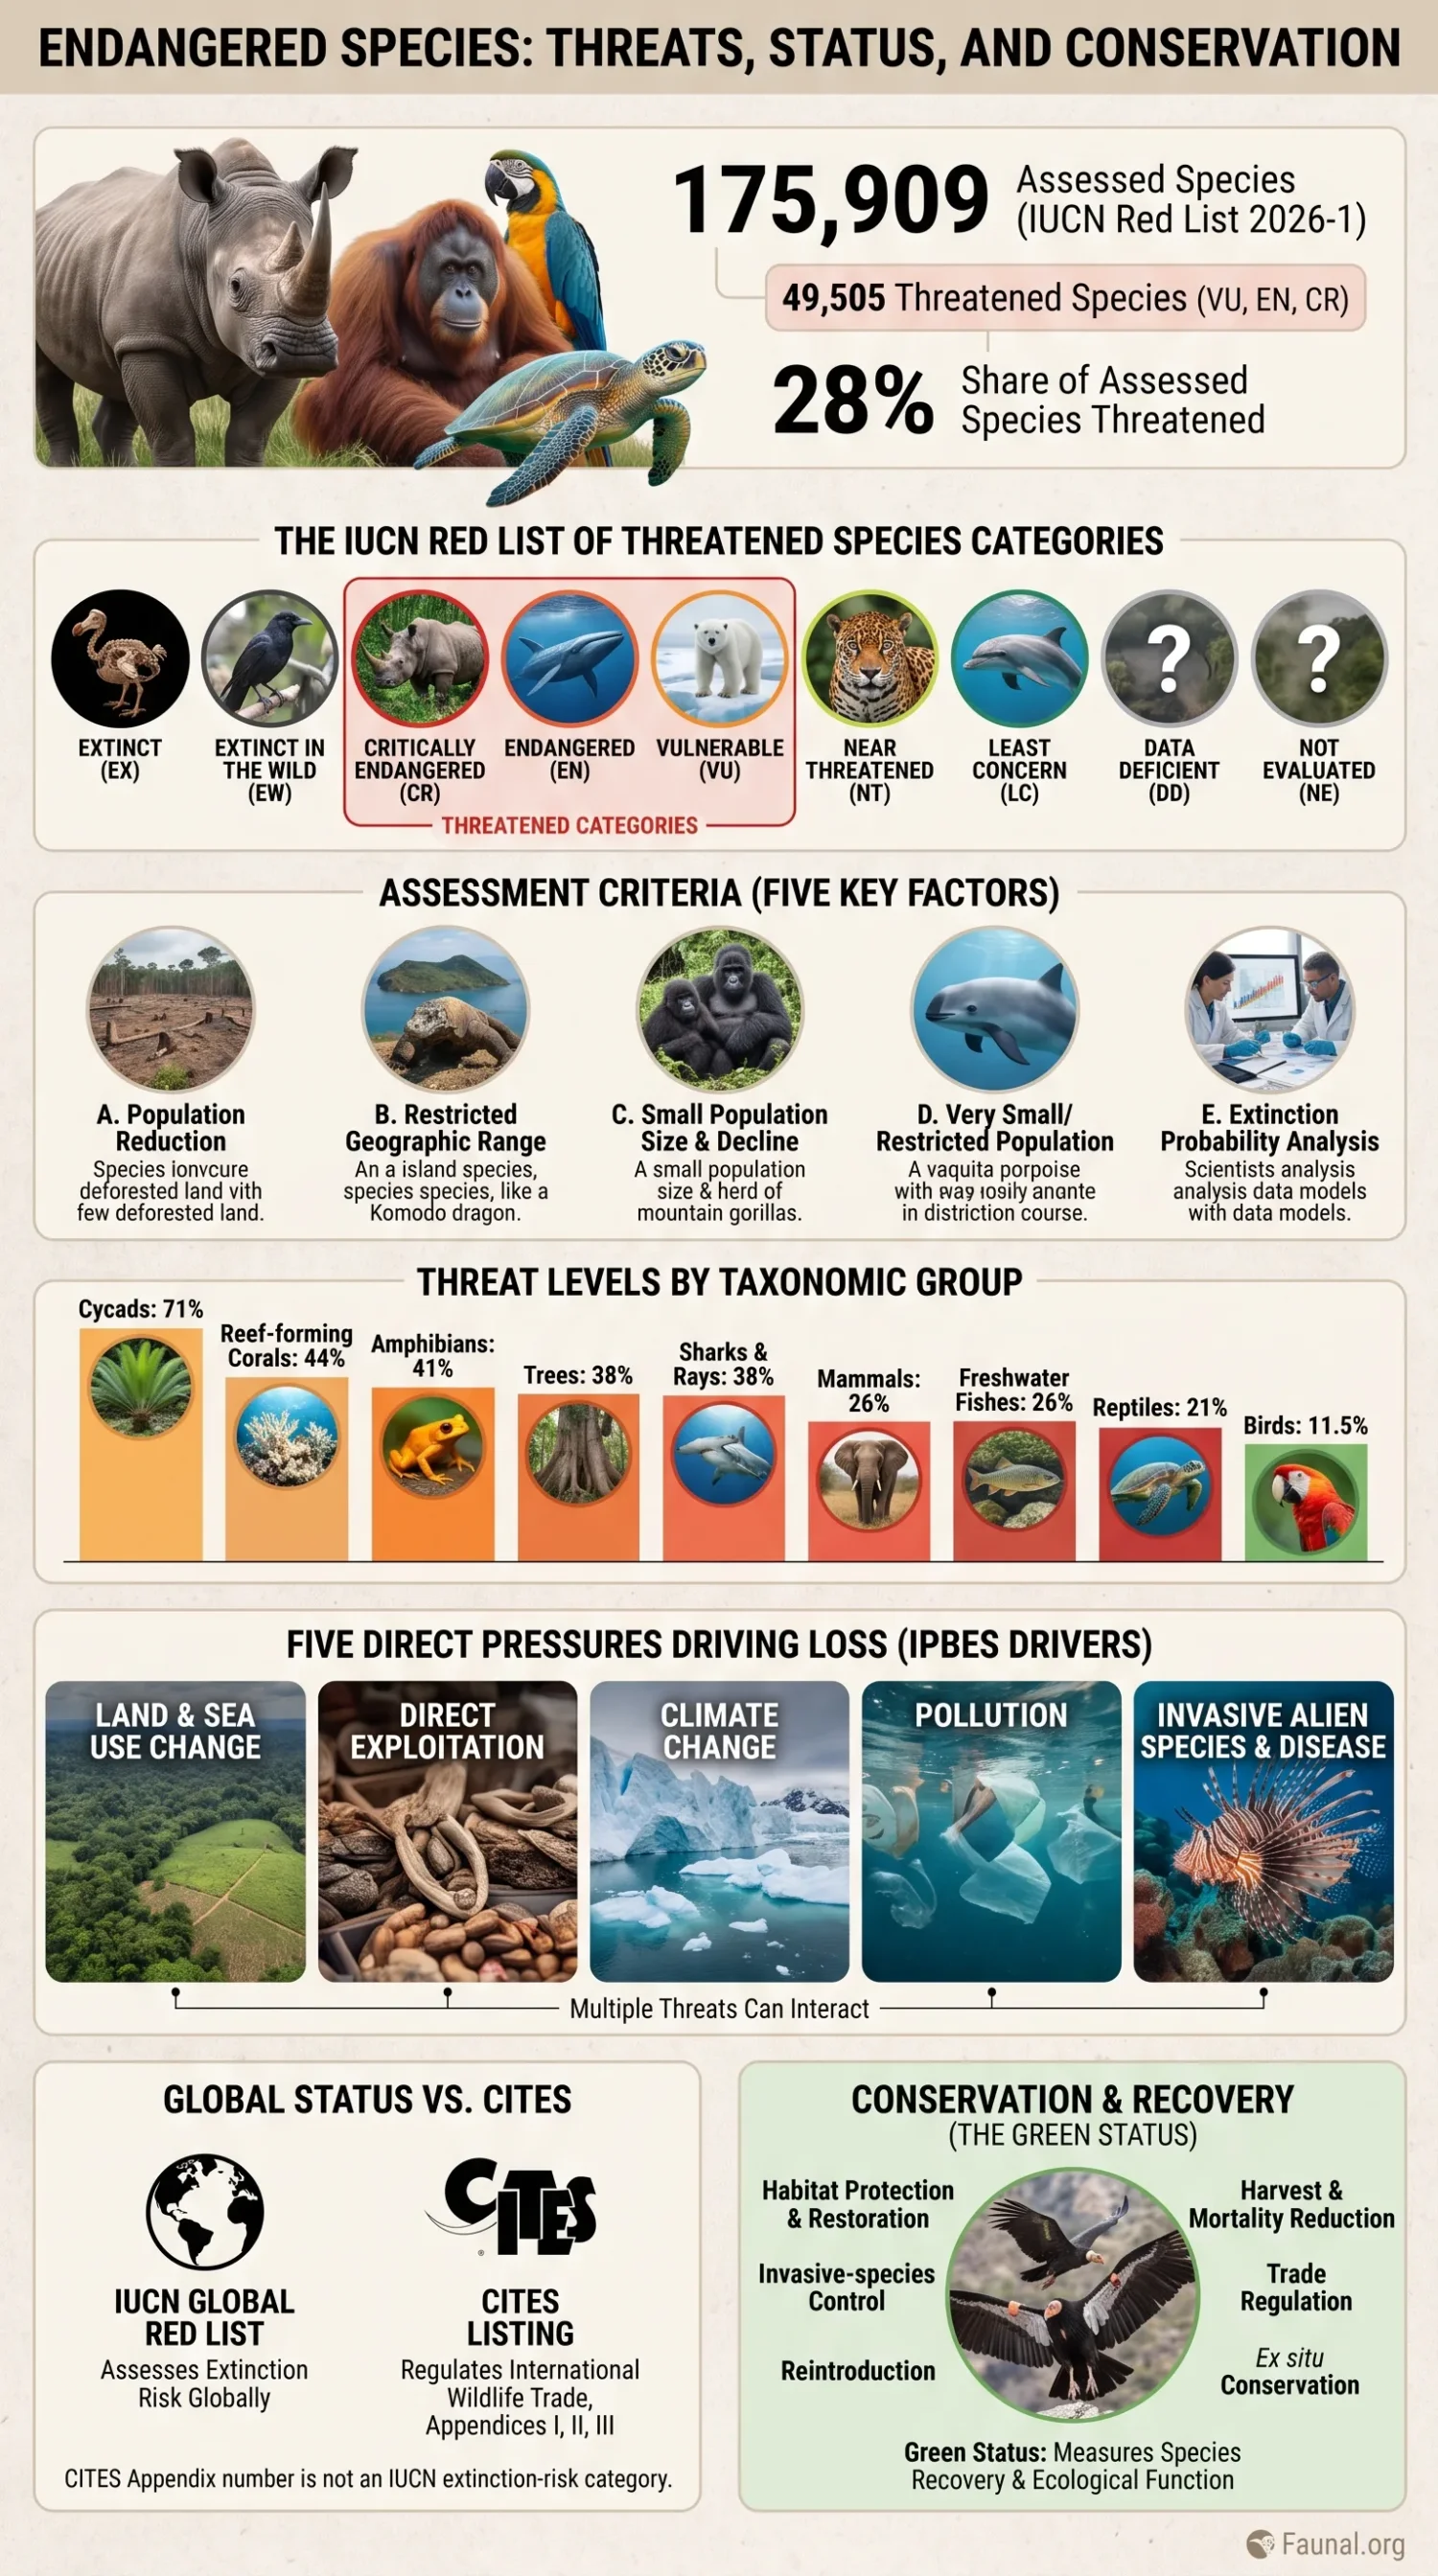
An endangered species is a species facing a very high risk of extinction in the wild under the IUCN Red List system. Endangered is one defined category, abbreviated EN. The broader IUCN term threatened species includes Vulnerable, Endangered and Critically Endangered species. In Red List version 2026-1, 175,909 species had been assessed and 49,505 were listed in those three threatened categories.
Species Assessed
175,909
Current IUCN Red List total reported for version 2026-1.
Threatened Species
49,505
Species assessed as Vulnerable, Endangered or Critically Endangered.
Share of Assessed Species
28%
The current IUCN headline proportion for assessed species threatened with extinction.
Endangered Is a Defined Extinction-Risk Category
The words endangered, threatened and rare are often used loosely in everyday language, but they do not mean the same thing in a Red List assessment. IUCN assigns a species to a category by applying standardized extinction-risk criteria to evidence about population change, geographic range, population size and, where possible, modeled extinction probability.
| IUCN Category | Code | Meaning | Threatened Category? |
|---|---|---|---|
| Not Evaluated | NE | The species has not yet been evaluated against the Red List criteria. Lack of evaluation is not evidence of low extinction risk. | No |
| Data Deficient | DD | Available information is inadequate for a direct or indirect assessment of extinction risk. | No, but risk may still be high |
| Least Concern | LC | The species has been evaluated and does not qualify for a higher-risk category. | No |
| Near Threatened | NT | The species does not currently qualify as threatened but is close to, or may soon qualify for, a threatened category. | No |
| Vulnerable | VU | The evidence indicates a high risk of extinction in the wild. | Yes |
| Endangered | EN | The evidence indicates a very high risk of extinction in the wild. | Yes |
| Critically Endangered | CR | The evidence indicates an extremely high risk of extinction in the wild. | Yes |
| Extinct in the Wild | EW | The species is known to survive only in cultivation, captivity or as a naturalized population well outside its former range. | Beyond the threatened categories |
| Extinct | EX | There is no reasonable doubt that the last individual has died. | No living wild population |
Data Deficient does not mean safe. It means the evidence needed to assign an extinction-risk category is missing or inadequate. Treating DD species as low-risk species can therefore hide poorly known conservation problems.
How Extinction Risk Is Assessed
IUCN assessments use five criteria, labeled A through E. A species does not have to meet every criterion. Meeting the threshold for a threatened category under one qualifying criterion can be enough, while some species meet several criteria at the same time.
| Criterion | Evidence Examined | Why It Matters |
|---|---|---|
| A | Population reduction over a defined time period | Detects species undergoing large past, current or projected declines. |
| B | Restricted geographic range combined with fragmentation, decline or extreme fluctuation | Identifies species whose limited distribution leaves them exposed to threats affecting much of their range. |
| C | Small population size together with continuing decline | Addresses species with few mature individuals and evidence that numbers are continuing to fall. |
| D | Very small population or very restricted distribution | Recognizes that a species can face high risk even before a measurable decline is documented. |
| E | Quantitative analysis of extinction probability | Uses population models or other quantitative methods when suitable data are available. |
The supporting evidence in an assessment may include extent of occurrence, area of occupancy, number of locations, number of mature individuals, population structure, continuing decline, extreme fluctuations, habitat dependence, recorded threats and conservation measures. The relevant measurements differ among species because a wide-ranging marine animal, an island plant and a cave-restricted invertebrate do not face extinction through identical biological pathways.
Threat Levels Differ Sharply Among Taxonomic Groups
A single percentage for all life would give a misleading impression because Red List coverage is uneven. IUCN therefore provides more defensible threatened-species estimates for groups in which most recognized species have been assessed. The 2026-1 estimates below refer to groups with comparatively high assessment coverage and include uncertainty from Data Deficient species.
| Taxonomic Group | Best Estimate Threatened | Reported Range |
|---|---|---|
| Cycads | 71% | 70–71% |
| Reef-forming corals | 44% | 38–51% |
| Amphibians | 41% | 37–48% |
| Trees | 38% | 35–43% |
| Sharks, rays and chimaeras | 38% | 33–45% |
| Conifers | 34% | 34–35% |
| Mammals | 26% | 23–36% |
| Freshwater fishes | 26% | 22–39% |
| Reptiles | 21% | 18–33% |
| Birds | 11.5% | 11.4–11.8% |
These percentages should not be treated as a ranking of every animal and plant lineage on Earth. Many invertebrates, fungi and other less-studied groups do not yet have comparable assessment coverage. Adding newly assessed species can also raise the number of threatened species without proving that extinction risk suddenly worsened during that Red List update.
Two Different Global Numbers
The IUCN total of 49,505 threatened species refers to species individually assessed and placed in Vulnerable, Endangered or Critically Endangered categories. The IPBES Global Assessment produced a broader estimate that around one million animal and plant species may be threatened with extinction. That figure is an extrapolated global estimate, not a count of one million individual IUCN Red List assessments.
Five Direct Pressures Account for Much of Global Biodiversity Loss
IPBES groups the main direct human-driven pressures on biodiversity into five broad drivers: land and sea use change, direct exploitation of organisms, climate change, pollution and invasive alien species. Their relative importance changes between terrestrial, freshwater and marine systems, and a threatened species may be affected by several at once.
Land and sea use change
Conversion of forests, grasslands, wetlands, rivers, coastlines and other habitats can reduce the area available to a species, separate populations and alter food, shelter or breeding sites. Agriculture, urban development, transport infrastructure, dams, mining, logging and coastal development can all contribute, but the biological effect depends on the habitat requirements of the species concerned.
Direct exploitation
Fishing, hunting, logging, plant collection and capture for wildlife trade can remove individuals faster than populations replace them. The pressure may be legal or illegal. Risk depends on harvest level, reproduction, age at maturity, population size, enforcement and whether removal is concentrated on breeding adults or restricted populations.
Climate change and severe weather
Warming, changing rainfall, marine heat, drought, sea-level rise, loss of ice and altered extreme-weather patterns can change habitat suitability and the timing of breeding, migration or food availability. Species with narrow climatic tolerances, limited dispersal options or restricted ranges can have little room to shift as conditions change.
Pollution
Agricultural chemicals, nutrient runoff, industrial contaminants, wastewater, plastics and other pollutants can cause direct mortality or alter reproduction, prey availability and habitat quality. The relevant pollutant and exposure pathway vary widely among freshwater, marine and terrestrial species.
Invasive alien species and disease
Introduced organisms can prey on native species, compete for resources, modify habitats, hybridize with related taxa or carry pathogens into populations that have little resistance. Island species and other evolutionarily isolated populations can be especially exposed when novel predators, competitors or diseases arrive.
IUCN records threats at a finer level than these five global drivers. Assessors can document whether a pressure is historical, ongoing or expected in the future and consider its geographic scope and the severity of the resulting decline. A threat name alone does not show how strongly it affects a particular species.
Multiple Threats Can Push the Same Population Toward Extinction
Species often decline through interacting pressures rather than one isolated cause. Habitat fragmentation can leave a population smaller and more separated while harvest removes breeding individuals. Climate shifts can reduce habitat quality at the same time that invasive predators or disease increase mortality. Pollution may affect reproduction in a population already restricted to a few sites.
Once populations become very small, the biology of small populations can add further risk. Loss of genetic diversity, inbreeding, skewed sex ratios, chance variation in births and deaths, local disasters and difficulty finding mates can all matter. Removing the original pressure may therefore be necessary without being sufficient for rapid recovery.
Global and National Endangered Status Can Be Different
A global Red List category describes extinction risk across the species as a whole. A national or regional assessment considers the population within a smaller geographic boundary. The resulting categories can legitimately differ.
A species assessed as Least Concern globally could be Critically Endangered in a country where only a small, declining population remains. The reverse can also occur: a species facing global decline may have a stable population inside one region. Regional assessments must also consider movement across borders, non-breeding populations, marginal populations and whether a taxon is indigenous to the assessment area.
Status Must Always Include Its Geographic Scale
“Endangered in Country A” and “Endangered globally” are not interchangeable statements. Conservation status should be reported with the assessment authority, geographic scope and assessment date whenever those details are available.
IUCN Status, CITES Listing and Legal Protection Measure Different Things
A common source of confusion is treating every conservation list as another version of the Red List. The systems have different purposes. A species can therefore have an IUCN category, a CITES appendix listing and one or more national legal designations at the same time.
| System | Main Question | Geographic or Legal Scope | What a Listing Means |
|---|---|---|---|
| IUCN Red List | How high is the species’ extinction risk? | Primarily global, with some regional assessments also published | Places the species in an evidence-based extinction-risk category. |
| CITES | How should international wildlife trade be controlled? | International treaty implemented by its Parties | Appendices I, II and III apply different controls to international trade. |
| National or regional conservation lists | What is the species’ status within the jurisdiction? | Country, state, province, territory or region | May provide a regional risk assessment, a legal designation or both, depending on the system. |
CITES Appendix I covers species threatened with extinction that are or may be affected by trade and subjects their international trade to especially strict controls. Appendix II also contains species that are not necessarily threatened with extinction now but whose trade must be controlled to avoid use incompatible with their survival. Appendix III covers species for which a Party seeks cooperation from other countries in controlling trade. The CITES checklist contains more than 36,000 animal and plant species.
A CITES Appendix number is not an IUCN extinction-risk category. Likewise, an IUCN Endangered assessment does not by itself specify which activities are prohibited under national law.
Conservation Must Remove the Pressures Causing the Decline
Effective conservation depends on the biology of the species and the reason it is declining. Protecting habitat will not by itself solve unsustainable hunting outside protected areas. Trade controls will not restore a wetland lost to water diversion. Captive breeding cannot provide lasting recovery if released animals return to an ecosystem where the original cause of mortality remains.
- Habitat protection: retaining breeding, feeding, shelter and migration areas needed for survival.
- Habitat restoration: repairing degraded ecosystems, reconnecting fragmented habitat and restoring ecological processes.
- Harvest and mortality reduction: changing fishing, hunting, logging or collection pressure and reducing accidental mortality such as bycatch.
- Invasive-species control: removing or containing introduced predators, competitors, pathogens or ecosystem-modifying species where feasible.
- Disease management: surveillance, biosecurity and targeted intervention when disease contributes materially to decline.
- Trade regulation: controlling international or domestic trade when collection and commerce threaten wild populations.
- Reintroduction and conservation translocation: restoring populations where suitable habitat and threat control make release biologically defensible.
- Ex situ conservation: captive breeding, botanical collections, seed banking or other managed populations used when wild populations need additional safeguards.
- Human-wildlife conflict management: reducing mortality while addressing the costs that coexistence can impose on local communities.
- Population monitoring: measuring whether abundance, range, reproduction or survival improves after intervention.
Evidence from 67,217 Red List animal species
A 2025 PLOS Biology study analyzed IUCN Red List information for 67,217 animal species. Conservation actions were reported for at least 34,847 species, or 51.8% of the study set, with protected areas the most frequently recorded action. The researchers found that six times more species had deteriorated in Red List category than improved, yet almost all species that improved had conservation actions in place.
Reintroductions were among the actions associated with improvement, while area management was also important for amphibians and birds. The authors cautioned that a reduction in extinction risk rarely meant full recovery. Documentation also differs among taxonomic groups, so absence of a reported action should not automatically be interpreted as proof that no conservation activity exists.
Reducing Risk Is Not the Same as Restoring a Species
A move from Critically Endangered to Endangered can represent a real improvement while the species remains far below its former abundance, distribution or ecological role. Red List category change measures extinction risk, not complete ecological recovery.
The Green Status Adds a Recovery Measure to Red List Risk
IUCN developed the Green Status of Species to complement the Red List by measuring recovery and the effect of conservation. Under this system, full recovery is more demanding than simply reaching a non-threatened Red List category.
A fully recovered species is expected to be present across the parts of its indigenous range used as the recovery baseline, to be viable in those areas and to perform its ecological functions there. This makes it possible for two statements to be true at once: a species may no longer face a high immediate extinction risk, yet still remain depleted or absent from large parts of its former range.
Species Recovery Is Also an International Biodiversity Target
CBD Target 4 calls for urgent management action by 2030 to halt human-driven extinction of known threatened species and support their recovery and conservation. It also addresses genetic diversity, in situ and ex situ conservation, sustainable management and human-wildlife interactions. The wording matters because preventing the final extinction event is only one part of conservation; maintaining viable populations and restoring depleted species are separate tasks.
Changes in Red List Numbers Do Not All Mean the Same Thing
The Red List is dynamic. Species are added as they are assessed for the first time, existing assessments are revised, taxonomy changes and new biological information becomes available. A rise in the number of species listed as threatened between two Red List releases can therefore have several causes.
IUCN distinguishes genuine status changes from changes caused by better knowledge, revised criteria application or taxonomy. A genuine deterioration occurs when the species itself has moved closer to extinction because threats continued, became stronger or new pressures emerged. A genuine improvement can occur when threats decline or conservation measures such as habitat management, reintroduction, legal protection or harvest management improve the species’ status.
Trend measures such as the Red List Index therefore rely on genuine category changes rather than simply comparing the raw number of threatened species in successive releases.
Assessment Gaps Still Limit What Can Be Said About Global Extinction Risk
The current Red List contains far more information for some groups than for others. Mammals, birds, amphibians, reptiles, freshwater fishes, reef-forming corals, sharks and rays, trees and several other groups have broad assessment coverage. Many invertebrates, fungi and other taxa remain less completely assessed.
This uneven coverage creates two limits. First, the 28% threatened figure describes the pool of assessed species, not a census of every described species. Second, percentages from groups with low assessment coverage can be biased if evaluation has concentrated on species already suspected to be at risk. IUCN therefore restricts many group-level threatened-percentage comparisons to taxa with high assessment coverage.
Assessment age also matters. IUCN aims to reassess species periodically, often within five to ten years depending on conservation concern, available information and capacity, but there is no fixed schedule for every taxon. A status should therefore be read together with its assessment date rather than treated as permanent.
A scientifically defensible endangered-species record needs more than a category label. The assessment scale, date, criteria, population and range evidence, documented threats and conservation actions determine what the status actually means.
Sources and Verification
- IUCN Red List of Threatened Species — Current totals for assessed and threatened species and the role of the Red List in extinction-risk assessment.
- IUCN Red List Summary Statistics — Version 2026-1 threatened-species proportions, assessment-coverage cautions and explanations of genuine category changes.
- IUCN Red List Categories and Assessment Information — Definitions of threatened categories, assessment criteria and reassessment timing.
- IUCN Threats Classification Scheme — Classification and recording of direct threats, including timing, scope and severity.
- IPBES Global Assessment Summary for Policymakers — Global extinction-risk estimate and the major direct drivers of biodiversity loss.
- IUCN Regional and National Red List Guidance — Differences between global and subglobal extinction-risk assessments.
- Checklist of CITES Species — Current searchable list of animal and plant taxa covered by the CITES appendices.
- CITES Appendix Definitions — Scope and purpose of Appendices I, II and III and their relationship to international wildlife trade.
- Simkins et al. 2025, PLOS Biology — Analysis of conservation actions and Red List category outcomes across 67,217 animal species.
- IUCN Green Status of Species — Recovery definition based on range, viability and ecological function.
- CBD Target 4 — International species-management objectives for halting extinction and supporting recovery by 2030.