Complete guides: •Regional Fauna Guides•Birds•Wildlife Habitat Guides•Fauna of Europe
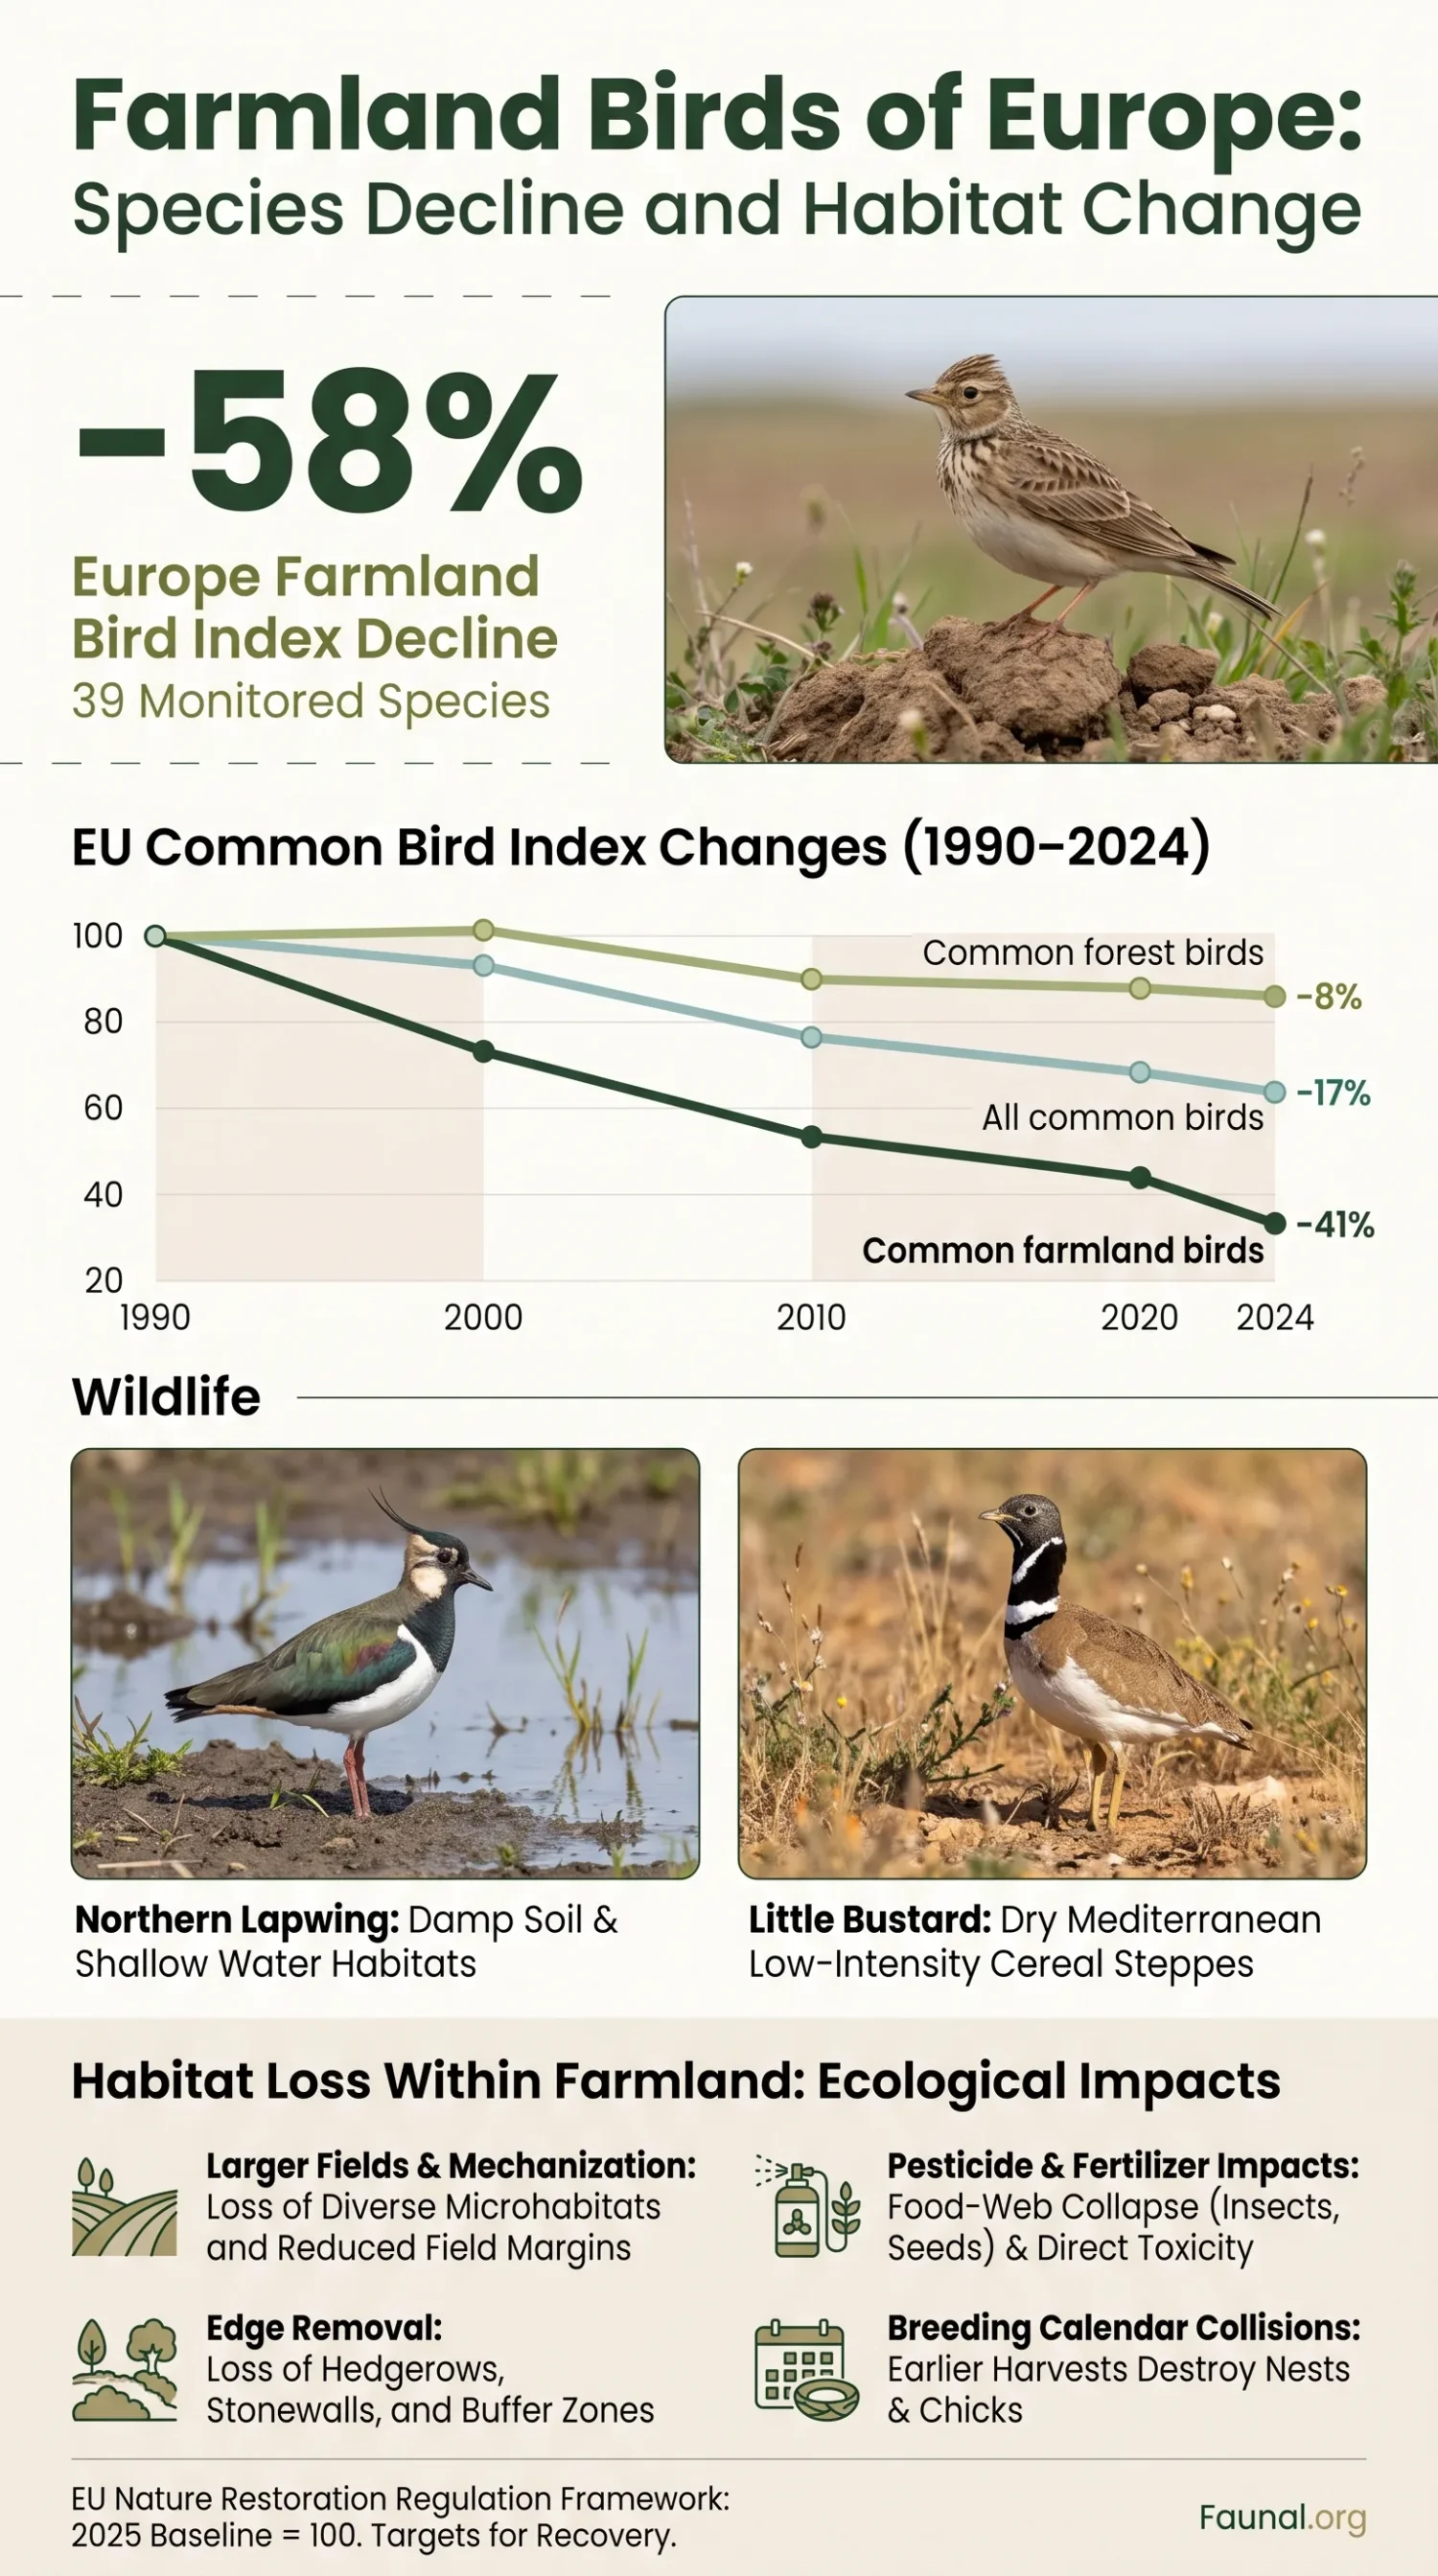
Europe’s Farmland Bird Index fell by 58% between 1980 and 2024 in the latest completed Pan-European Common Bird Monitoring Scheme release. The indicator combines 39 farmland-associated breeding bird species, so the figure describes change in a multi-species population index rather than showing that 58% of individual farmland birds have disappeared. The decline developed across farmed landscapes that still cover large areas but have often changed in structure, food supply, vegetation density, water regime and timing of disturbance.
Europe Farmland Bird Index
−58%
Change from 1980 to 2024 in the PECBMS European indicator.
European indicator set
39 species
Farmland-associated species contributing to the current European index.
2025 PECBMS update
30 countries
The wider European Wild Bird Indices release used data from 168 species across 30 countries.
The completed 2025 PECBMS release covers monitoring through 2024. Participating countries have since submitted 2025 monitoring data, but PECBMS reported in June 2026 that those data were still undergoing checks for the next European update planned for December 2026. The 1980–2024 series is therefore the appropriate completed European baseline for this page. PECBMS June 2026 report
A 58% Index Decline Is Not the Same as Losing 58% of All Farmland Birds
The Farmland Bird Index is a composite abundance indicator. National breeding-bird monitoring produces annual population indices for individual species; these are combined into a multi-species indicator for birds selected because of their dependence on farmland for feeding, nesting or both. The index tracks relative change. It is not a census of every bird living on European farms and it does not convert directly into a percentage of individual birds lost.
Why −58%, −52% and −41% can all be correct
PECBMS reports a 58% decline for Europe from 1980 to 2024 and a 52% decline for the EU over 1980–2024. The European Environment Agency reports a 41% decline for common farmland birds in the EU from 1990 to 2024. The figures use different geographic scopes and starting years. They describe related indicators, not competing estimates of one identical time series.
The EEA series is useful for comparing habitat groups because its farmland, forest and all-common-bird indices share the same EU geography and 1990 baseline. From 1990 to 2024, the farmland index fell 41%, compared with 17% for all 168 common birds and 8% for the 34 common forest birds monitored in the 26 EU Member States covered by the indicator. European Environment Agency Common Bird Index
EU common bird indices: change from 1990 to 2024
All three groups use the same 1990 baseline and EU monitoring scope, allowing a direct comparison of relative index change.
European Environment Agency, 26 EU Member States with monitoring schemes, 1990 = 100; values show change through 2024.
The 39 Species Behind Europe’s Farmland Bird Index
The European index is not built from a few headline species. PECBMS currently uses 39 farmland birds. In the 1980–2024 update, 26 are classified as moderate decline, one as steep decline, six as moderate increase, five as stable and one as uncertain. Individual species do not all begin in 1980 because sufficiently reliable supranational series became available in different years. Scientific names and trend classes below follow the current PECBMS Europe Farmland Bird Index.
| Species | Scientific name | Series base year | PECBMS trend class |
|---|---|---|---|
| Eurasian Skylark | Alauda arvensis | 1980 | Moderate decline |
| Red-legged Partridge | Alectoris rufa | 1998 | Moderate decline |
| Tawny Pipit | Anthus campestris | 1991 | Uncertain |
| Meadow Pipit | Anthus pratensis | 1980 | Moderate decline |
| Cattle Egret | Bubulcus ibis | 1998 | Moderate increase |
| Eurasian Stone-curlew | Burhinus oedicnemus | 1998 | Moderate decline |
| Greater Short-toed Lark | Calandrella brachydactyla | 1998 | Moderate increase |
| White Stork | Ciconia ciconia | 1980 | Moderate increase |
| Rook | Corvus frugilegus | 1980 | Moderate increase |
| Common Whitethroat | Curruca communis | 1980 | Moderate increase |
| Corn Bunting | Emberiza calandra | 1980 | Moderate decline |
| Cirl Bunting | Emberiza cirlus | 1989 | Stable |
| Yellowhammer | Emberiza citrinella | 1980 | Moderate decline |
| Ortolan Bunting | Emberiza hortulana | 1980 | Moderate decline |
| Black-headed Bunting | Emberiza melanocephala | 2002 | Moderate decline |
| Common Kestrel | Falco tinnunculus | 1980 | Moderate decline |
| Crested Lark | Galerida cristata | 1998 | Moderate decline |
| Thekla Lark | Galerida theklae | 1998 | Moderate increase |
| Barn Swallow | Hirundo rustica | 1980 | Moderate decline |
| Red-backed Shrike | Lanius collurio | 1980 | Stable |
| Lesser Grey Shrike | Lanius minor | 1999 | Moderate decline |
| Woodchat Shrike | Lanius senator | 1998 | Moderate decline |
| Black-tailed Godwit | Limosa limosa | 1984 | Moderate decline |
| Common Linnet | Linaria cannabina | 1980 | Moderate decline |
| Calandra Lark | Melanocorypha calandra | 1998 | Moderate decline |
| Western Yellow Wagtail | Motacilla flava | 1980 | Moderate decline |
| Western Black-eared Wheatear | Oenanthe hispanica | 1998 | Moderate decline |
| Eurasian Tree Sparrow | Passer montanus | 1980 | Moderate decline |
| Grey Partridge | Perdix perdix | 1980 | Moderate decline |
| Rock Sparrow | Petronia petronia | 1998 | Stable |
| Whinchat | Saxicola rubetra | 1980 | Moderate decline |
| Common Stonechat | Saxicola torquatus | 1989 | Stable |
| European Serin | Serinus serinus | 1982 | Moderate decline |
| European Turtle Dove | Streptopelia turtur | 1980 | Moderate decline |
| Spotless Starling | Sturnus unicolor | 1998 | Moderate decline |
| Common Starling | Sturnus vulgaris | 1980 | Moderate decline |
| Little Bustard | Tetrax tetrax | 1998 | Steep decline |
| Hoopoe | Upupa epops | 1989 | Stable |
| Northern Lapwing | Vanellus vanellus | 1980 | Moderate decline |
A declining community indicator does not mean that every farmland species is declining. Cattle Egret, White Stork, Rook, Common Whitethroat, Greater Short-toed Lark and Thekla Lark are currently classified as moderate increases in this European indicator, while several others are stable. The community-level decline results from the combined trajectories of all 39 species.
European Farmland Is a Mosaic, Not One Bird Habitat
“Farmland” can describe a cereal field, grazed pasture, hay meadow, fallow parcel, orchard, ditch network, hedged field system, drained plain or dry Mediterranean cereal-steppe. Birds associated with these landscapes do not use the same vegetation height, moisture level or boundary structure. Some nest within crops; others need shrubs, trees or buildings for nesting but feed over open fields. Wet-grassland birds can occupy agricultural land while depending on water conditions that an ordinary land-cover map does not reveal.
| Farmland component | Examples from the indicator | Ecological structure involved |
|---|---|---|
| Open arable fields and fallow | Eurasian Skylark, Corn Bunting, Grey Partridge, Calandra Lark | Open or patchy vegetation, accessible ground, seeds, invertebrates and in-field nesting opportunities. |
| Hedges, scrub and field boundaries | Yellowhammer, Common Linnet, Common Whitethroat, European Turtle Dove | Nesting cover, song posts, shelter, seeds, fruits and invertebrate-rich edge habitat. |
| Pasture and meadow | Meadow Pipit, Whinchat, Common Starling | Grass structure, grazing pattern, cutting regime and access to surface-active invertebrates. |
| Wet farmland | Northern Lapwing, Black-tailed Godwit | Sparse nesting vegetation, damp soil, shallow water and accessible soil invertebrates. |
| Dry Mediterranean mosaics | Little Bustard, Eurasian Stone-curlew, Crested Lark, Calandra Lark | Low-intensity open ground, fallow, dry grassland and crop mosaics with varied vegetation height. |
This distinction matters because the number of hectares labelled “agricultural land” can remain similar while the amount of usable bird habitat changes sharply. A uniform crop block and a mixed landscape of crops, fallow, grassy margins, hedges, wet hollows and uncultivated corners may occupy the same total area but provide very different nesting sites, food and refuge.
How Farmland Can Lose Bird Habitat Without Ceasing to Be Farmland
Larger Fields Remove Internal Edges and Non-crop Structure
Combining several small fields into one larger field does more than alter field size. Internal boundaries can disappear with their grassy strips, hedge sections, ditches, rough corners and uncultivated vegetation. The cropped area may remain productive farmland while the amount of edge habitat per unit area falls. Landscape studies have repeatedly found field size and habitat heterogeneity to be related to biodiversity within agricultural systems.
The ecological value of an edge also depends on its condition. A narrow, frequently cut grass strip is not equivalent to a floristically varied margin beside a hedge. A review of arable field margins found that different margin designs provide different combinations of seeds and invertebrates, with no single margin type supplying the best food resources throughout the entire year. Review of food provision from arable field margins
Pesticides and Fertilisers Can Alter the Food Web Before a Bird Disappears
Many farmland birds depend on plants and invertebrates rather than directly on the crop being grown. Herbicide use can reduce seed-producing non-crop plants; insecticides can alter arthropod availability; fertilisation can change vegetation density and plant composition. These changes can affect birds indirectly through food access and vegetation structure as well as through direct exposure pathways.
A 2023 analysis linked population time series for 170 common bird species at more than 20,000 sites in 28 European countries with agricultural intensification, forest-cover change, urbanisation and temperature change over 37 years. Among the pressures tested, agricultural intensification — particularly pesticide and fertiliser use — showed the strongest negative relationship with most bird population trends, with especially strong effects among invertebrate feeders. Rigal et al., Proceedings of the National Academy of Sciences
A seed-eating adult bird can still depend on insects during reproduction. Chicks of many farmland species require protein-rich invertebrate prey, so a landscape can retain adult food while becoming poorer breeding habitat.
The Breeding Calendar Can Collide With the Farming Calendar
Ground-nesting birds experience farmland as a sequence of changing conditions rather than a static habitat map. Crop height, canopy closure, mowing, harvesting, cultivation and grazing can alter a field within days or weeks. A parcel that attracts a territorial bird early in spring may become too dense for foraging later, or a nest can be exposed to mechanical operations before young have fledged.
Occupied field does not automatically mean productive breeding habitat
Presence records show that birds used a field. They do not by themselves establish nest survival, fledging success or whether the same parcel remained suitable through successive breeding attempts.
A 2026 study on nine intensively managed German farms illustrates the point for the Eurasian Skylark. The species used legume plots and low-input cereal strips in maize more heavily than their control fields, while annual fallows and dedicated farmland-bird plots also received more use. The study also discusses how dense crops and a shift toward winter cereals can reduce suitable breeding conditions later in the season. These are results from German commercial farms, not an estimate of effect size for every European farming system. Beninde and Hunke, Journal for Nature Conservation
Winter Food Can Be a Separate Bottleneck
A farmland landscape must function outside the nesting season as well. Stubbles, uncultivated vegetation, seed-rich margins, fallow and spilled grain can contribute food during autumn and winter. The field-margin review found that seed-rich winter habitats and structurally varied summer margins provide different resources; no single margin treatment supplied optimal food across the year.
The annual cycle therefore matters. A landscape can offer spring nesting cover but little winter food, or abundant winter seed while lacking safe breeding structure. Population change reflects survival and reproduction across the whole cycle rather than the appearance of a field during one visit.
Five Indicator Birds Reveal Different Habitat Bottlenecks
The same downward community signal can be produced by different ecological problems. Five members of the European indicator show why farmland-bird decline cannot be reduced to one habitat feature.
| Species | Current PECBMS class | Habitat bottleneck illustrated |
|---|---|---|
| Eurasian Skylark Alauda arvensis |
Moderate decline | Requires usable open structure within fields and opportunities for repeated breeding attempts; dense crops can become less suitable as the season advances. |
| Grey Partridge Perdix perdix |
Moderate decline | Shows the need to combine nesting cover with invertebrate-rich chick feeding areas, seed resources and refuge rather than supplying only one resource. |
| Northern Lapwing Vanellus vanellus |
Moderate decline | Depends on open nesting structure and access to short, damp feeding habitat; drainage and tall, dense vegetation can remove usable conditions. |
| European Turtle Dove Streptopelia turtur |
Moderate decline | Links woody or scrub nesting cover with accessible seed-rich feeding habitat. Its trajectory also shows that pressures away from breeding habitat can matter. |
| Little Bustard Tetrax tetrax |
Steep decline | Represents low-intensity open agricultural mosaics where fallow, extensive grassland and varied vegetation structure can be central components. |
Northern Lapwing provides a fine-scale example from the Po Plain in Italy. A study of 67 nests found 94% in wetlands and summer crops; wetlands were the only habitat actively selected, and the likelihood of nesting in cropland fell as plant height and ground cover rose. The finding does not define Lapwing habitat across all of Europe, but it shows why “cropland” alone is too broad a habitat category. Serra and colleagues, European Journal of Wildlife Research
Little Bustard provides a Mediterranean example. In Spain, a national analysis for 2002–2017 found annual change in fallow area strongly associated with change in the Spanish Farmland Bird Index, cereal-bird index and Little Bustard index. The study documented a 1.1-million-hectare decline in Spanish fallow over the wider 15-year period it examined. This is evidence from Spain rather than a Europe-wide conversion factor, but it demonstrates that the amount of uncropped rotational land can track bird-community change at national scale. Traba and Morales, Scientific Reports
European Turtle Dove adds another caution. PECBMS reports an overall long-term decline, while flyway-specific monitoring has shown a recent improvement in the western flyway following hunting moratoria and restrictions. Habitat loss and intensive agriculture remain among documented pressures, but hunting and trapping also affect this migrant. A farmland indicator species can therefore respond to pressures operating far beyond the field where it breeds. PECBMS Turtle Dove flyway assessment
Regional Decline Figures Use Different Starting Years and Species Sets
PECBMS also calculates regional Farmland Bird Indices, but the four regional values should not be treated as a simple ranking. South Europe begins in 1989, Central and East Europe in 1982, and the number of species ranges from 14 in North Europe to 37 in South Europe. A lower percentage decline can therefore reflect a different time window and indicator composition as well as a different ecological history.
| PECBMS region | Monitoring period | Species in regional indicator | Indicator change |
|---|---|---|---|
| West Europe | 1980–2024 | 22 | −52% |
| North Europe | 1980–2024 | 14 | −46% |
| South Europe | 1989–2024 | 37 | −46% |
| Central & East Europe | 1982–2024 | 23 | −29% |
| Europe | 1980–2024 | 39 | −58% |
The European total is also not an arithmetic average of the four percentages. PECBMS builds multi-species indicators from population indices and their statistical treatment; regional series differ in coverage and the species that can be included. PECBMS European and regional indicators
Intensification and Land Abandonment Can Push Specialists in Different Ways
Agricultural intensification is a major part of the European decline, but it is not the only land-use pathway that can reduce open-country specialists. In some marginal farming regions, abandonment removes agriculture from the landscape rather than making it more intensive. Grassland, pasture and former fields can then pass through taller herbaceous vegetation, scrub and eventually greater woody cover.
A study across 70 sites in Albania, Bulgaria, Croatia and Greece followed a forest-encroachment gradient associated with agricultural abandonment. Farmland birds and species of European conservation concern declined along that gradient while the bird community shifted with increasing woody cover. The result is geographically bounded to the Balkan study area, but it demonstrates that loss of open agricultural structure can occur through abandonment as well as intensification. Study of agricultural abandonment in south-eastern Europe
A 2026 resurvey of 213 two-by-two-kilometre grid cells in the Côa River basin of western Iberia provides a useful counterpoint. Median local bird richness increased by five species, or 28%, between the historical and recent survey periods, and total abundance also rose. The gains were driven mainly by forest-associated and generalist birds, while farmland specialists stagnated or declined slightly. Total bird diversity can therefore rise during rural landscape transition even while the specialist farmland component fails to recover. Monteiro and colleagues, Oecologia
Habitat Quality Depends on a Chain of Resources Across the Year
Nest site → chick food → adult food → refuge → winter food → movement between usable patches. Failure at one stage can limit a population even when the other resources remain available.
This is why one landscape feature cannot represent farmland quality for every species. Hedgerows may provide nest cover and food for edge-associated birds but do little for a Skylark that avoids tall woody boundaries. Bare or sparsely vegetated ground can suit Lapwing nesting but is not a substitute for seed-rich winter habitat. Fallow can supply several resources, yet its value changes with age, vegetation structure and management.
| Landscape feature | Bird resources it can provide | Why condition matters |
|---|---|---|
| Hedgerows and woody boundaries | Nest cover, shelter, berries, seeds, invertebrates and movement corridors for edge-associated species. | Height, width, cutting regime and connection with adjacent margins alter their value. |
| Grassy or flower-rich margins | Invertebrate prey, plant seeds, cover and uncropped feeding space. | Frequently cut grass-only strips can supply fewer food resources than more varied vegetation. |
| Fallow parcels | Seeds, invertebrates, nesting or foraging vegetation and structural diversity within arable landscapes. | Vegetation density, fallow age, disturbance and seasonal management change which species benefit. |
| Stubbles and seed-rich winter plots | Autumn and winter seed resources. | Early cultivation or low seed availability can shorten the period when food remains accessible. |
| Ditches, wet hollows and small wetlands | Moist soils, aquatic-edge prey, shallow feeding areas and locally sparse vegetation. | Drainage, steep banks or dense vegetation can change access for wet-farmland species. |
| Extensively managed grassland | Nesting cover, soil and surface invertebrates, mixed vegetation heights. | Mowing date, grazing intensity and vegetation height determine whether structure remains usable. |
| Low-disturbance corners and patches | Temporary refuge during field operations and additional feeding or nesting structure. | Small patches can lose value if isolated from the other resources required during the annual cycle. |
Green Cropland Is Not Automatically High-quality Bird Habitat
Land-cover area alone can hide ecological change. Two landscapes may contain the same percentage of cropland while differing in average field size, crop diversity, hedge length, fallow area, wet features, pesticide exposure, vegetation density and timing of operations. Those differences determine whether a bird can reach food, conceal a nest, complete a breeding attempt and survive outside the breeding season.
The same distinction applies to apparently “natural” recovery following abandonment. More shrubs and trees can raise total bird richness by adding woodland and generalist species while simultaneously reducing habitat for birds adapted to open agricultural mosaics. Monitoring farmland specialists separately from total species richness prevents these two ecological outcomes from being merged into one biodiversity number.
The EU Farmland-bird Recovery Metric Now Uses a 2025 Baseline
The EU Nature Restoration Regulation gives the national Common Farmland Bird Index a formal restoration metric. Under Article 11, national indices based on the species listed for each Member State are indexed so that 1 September 2025 = 100. The regulation divides Member States into groups with historically more depleted and less depleted farmland-bird populations and sets different index levels for 2030, 2040 and 2050.
| National farmland-bird group | 2030 | 2040 | 2050 |
|---|---|---|---|
| Historically more depleted populations | 110 | 120 | 130 |
| Historically less depleted populations | 105 | 110 | 115 |
These are national index targets for Member States, not individual targets imposed on each farmer. The regulation also states that national farmland-bird indices use species sets relevant to each Member State, so the national indicators are not identical to the 39-species PECBMS European index. Its examples of high-diversity agricultural landscape features include fallow land, hedgerows, field margins, ditches, streams, small wetlands, tree rows, small ponds and other non-productive or semi-natural structures. Regulation (EU) 2024/1991
Recovery Has to Appear in More Than One Species and More Than One Season
A genuine community recovery would be visible as a sustained rise in the multi-species indicator rather than the expansion of only a few adaptable species. At field and landscape scale, it would also require enough breeding habitat, chick food, adult food, refuge and winter resources for declining specialists to complete their annual cycles. Monitoring must therefore separate total richness from the condition of farmland-dependent birds.
A Europe-wide modelling study published in 2026 shows why this distinction remains relevant. Researchers analysed 265 common bird and 144 butterfly species from more than 20,000 sites in 27 countries and projected responses to land-use, land-use-intensity and climate scenarios through 2050. Scenarios meeting conservation objectives produced relatively better projected bird trends than alternative futures, yet average bird abundance still declined in the models, with farmland birds among the groups that remained difficult to reverse. These are scenario projections rather than observations of what will necessarily happen. Rigal and colleagues, Nature Ecology & Evolution
The European indicator therefore describes more than a reduction in the number of birds seen over fields. It records long-term change in an assemblage whose members depend on different combinations of open ground, crop structure, field edges, wet soil, fallow, scrub, grassland and seasonal food. Keeping those ecological functions visible is essential when the same area can remain labelled farmland while becoming a very different habitat for birds.
Sources and Verification
- PECBMS — Farmland Bird Index, Europe — Used for the 1980–2024 European indicator, all 39 scientific names, species base years and trend classifications.
- PECBMS — European Wild Bird Indices, 2025 update — Used for the completed 1980–2024 monitoring scope, 168-species wider indicator set and 30-country data coverage.
- PECBMS — June 2026 project report — Used to establish that 2025 monitoring submissions were undergoing checks for the next planned European update.
- European Environment Agency — Common Bird Index in Europe — Used for the EU 1990–2024 farmland, forest and all-common-bird comparisons and the 26-country monitoring scope.
- Rigal et al. — Farmland practices are driving bird population decline across Europe — Used for the 28-country, 170-species analysis of agricultural intensification, pesticides, fertilisers and other pressures.
- Vickery et al. — Arable field margins managed for biodiversity conservation — Used for evidence on summer and winter food resources, margin vegetation and the need for varied margin types.
- Beninde and Hunke — Agri-environmental measures for Eurasian Skylark in Germany — Used for 2026 evidence on Skylark use of in-crop measures, fallow and breeding-season field structure.
- Serra et al. — Northern Lapwing habitat selection in an intensive agroecosystem — Used for nest placement, wetland selection and relationships with vegetation height and ground cover in the Po Plain.
- Traba and Morales — Farmland bird decline and fallow loss in Spain — Used for the national relationship between fallow-area change, Spanish farmland-bird indices and Little Bustard.
- PECBMS — Turtle Dove flyway monitoring — Used for the distinction between the species’ wider decline and recent western-flyway response under hunting restrictions.
- Agricultural land abandonment and bird communities in south-eastern Europe — Used for farmland-bird responses along the forest-encroachment gradient in Albania, Bulgaria, Croatia and Greece.
- Monteiro et al. — Increasing bird diversity in a landscape in transition — Used for the 2026 western Iberian resurvey showing gains in total richness alongside stagnation or slight decline among farmland specialists.
- EUR-Lex — Regulation (EU) 2024/1991 on nature restoration — Used for the national Common Farmland Bird Index baseline, 2030–2050 index levels and listed high-diversity agricultural landscape features.
- Rigal et al. — Predicted decline in common bird and butterfly species under European scenarios — Used for the 2026 projections through 2050 and their distinction from observed monitoring trends.
Related Topics
- → Birds of Europe: Species Diversity, Habitats, and Biogeographic Regions
- → Urban Birds of Europe: Common Species in Towns and Cities
- → Forest Birds of Europe: Woodland Species and Breeding Habitats
- → Wildlife of Western Europe: Landscapes, Species, and Conservation
- → Wildlife of Eastern Europe: Forests, Wetlands, and Steppe Species
- → Wildlife of Northern Europe: Boreal Forests, Tundra, and Coasts